If we refresh the data entities due to changes to our metadata, it has been taking a while before. Microsoft tried to address this by moving the process out to run in a batch job, but there are things that we may still do to improve our DB performance and health. You can follow the tips below to carry out the Data Entity refresh performance improvements.
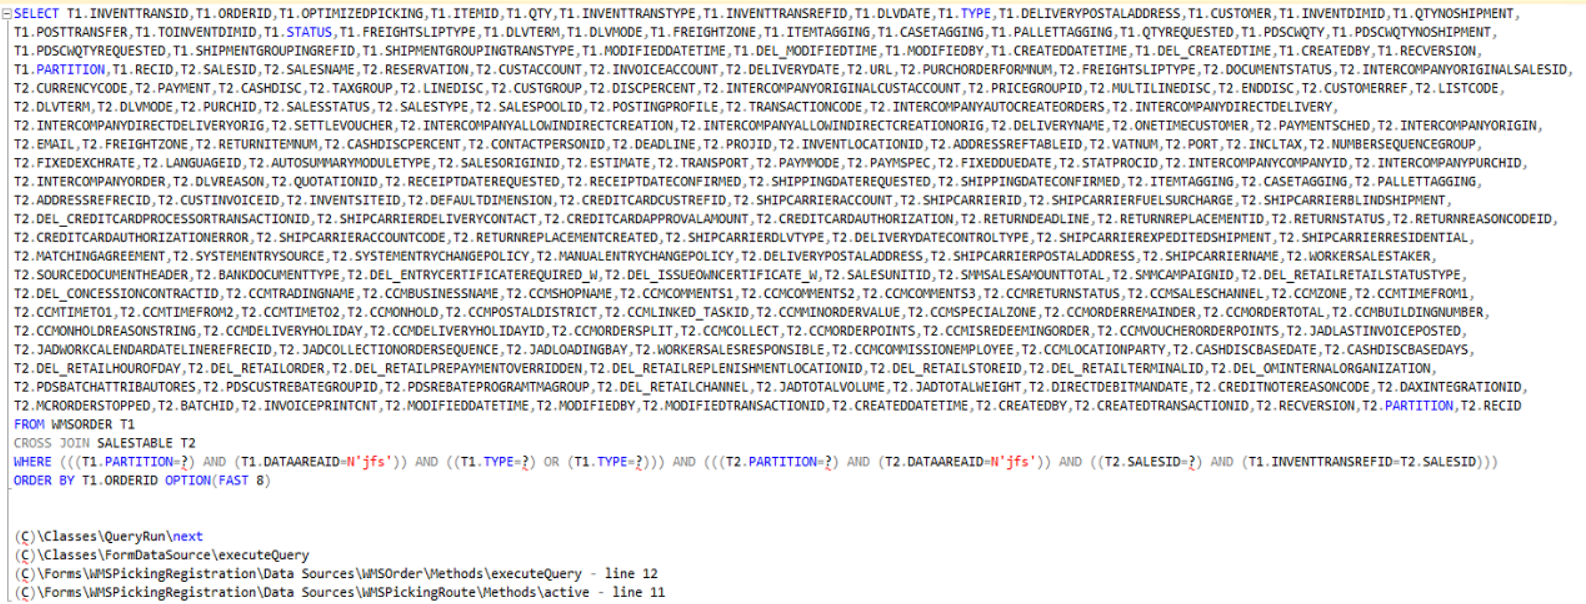
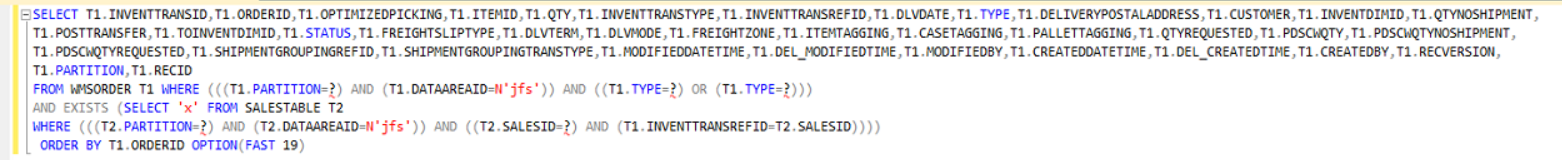
When checking the entity refresh on a local VHD, we have noticed in the query profiler that there is a potential covering index missing. We have extended the DMFTargetXML table:
The other idea came from a blog article about SQL DMV views performing poorly when querying the DB metadata. The regular index/statistics update scripts do not touch system tables, but with the below snippet you may update statistics on those too, greatly improving performance.
--identify last stats update date
SELECT
QUOTENAME(OBJECT_SCHEMA_NAME(i.object_id)) + N'.' + QUOTENAME(OBJECT_NAME(i.object_id)) + N'.' + QUOTENAME(name) AS index_name
, STATS_DATE(i.object_id, i.index_id) AS stats_date
FROM sys.indexes AS I
JOIN sys.partitions AS p ON
p.object_id = i.object_id
AND p.index_id = i.index_id
WHERE
OBJECTPROPERTYEX(i.object_id, 'IsSystemTable') = 1
AND i.index_id > 0
AND p.rows > 0;
--use XML PATH for SQL 2016 and earlier
DECLARE @SQL nvarchar(MAX) =
(
SELECT
N'UPDATE STATISTICS '
+ QUOTENAME(OBJECT_SCHEMA_NAME(i.object_id))
+ N'.'
+ QUOTENAME(OBJECT_NAME(i.object_id))
+ N';'
FROM sys.indexes AS i
JOIN sys.partitions AS p ON
p.object_id = i.object_id
AND p.index_id = i.index_id
WHERE
OBJECTPROPERTYEX(i.object_id, 'IsSystemTable') = 1
AND i.index_id > 0
AND p.rows > 0
FOR XML PATH(''), TYPE).value('.','nvarchar(MAX)'
);
EXEC sp_executesql @SQL;
--use STRING_AGG() in SQL 2017 and later, including Azure SQL Database
DECLARE @SQL nvarchar(MAX) =
(
SELECT
STRING_AGG(
N'UPDATE STATISTICS '
+ QUOTENAME(OBJECT_SCHEMA_NAME(i.object_id))
+ N'.'
+ QUOTENAME(OBJECT_NAME(i.object_id))
+ N';'
,'')
FROM sys.indexes AS i
JOIN sys.partitions AS p ON
p.object_id = i.object_id
AND p.index_id = i.index_id
WHERE
OBJECTPROPERTYEX(i.object_id, 'IsSystemTable') = 1
AND i.index_id > 0
AND p.rows > 0
);
EXEC sp_executesql @SQL;
Carrying out the above steps should help to get back to development and testing faster after a Data Entity refresh.
During the cleanup exercise of our code upgrade to Dynamics 365 Finance and Operations we have noticed that many of our custom tables did not have the cacheLookup configured. It can have a negative performance impact on your system, so it is best practice to have this properly configured. You can find below a job to find tables without cacheLookup property set.
You can find more details about caching in the documentation:
Sometimes we have noticed that our SQL health report has shown an out of control TempDB growth. It has happened for example when we have triggered bulk invoiced sales order cleanup, or some other larger processes. You can find out more about monitoring TempDB growth for version store in these articles:
Running the following statement can tell you the currently occupied space overall, and per file in your TempDB. Our normal usage is around 2 GB, so having a 67GB space used looked very suspicious.
Plain text
Copy to clipboard
Open code in new window
EnlighterJS 3 Syntax Highlighter
SELECTSUM(CAST(FILEPROPERTY(name, 'SpaceUsed')/128.0ASDECIMAL(10,2))) AS [Space Used inMB]
FROM sysfiles
SELECTRTRIM(name) AS [Segment Name], groupid AS [Group Id], filename AS [File Name],
CAST(size/128.0ASDECIMAL(10,2)) AS [Allocated Size inMB],
CAST(FILEPROPERTY(name, 'SpaceUsed')/128.0ASDECIMAL(10,2)) AS [Space Used inMB],
CAST([maxsize]/128.0ASDECIMAL(10,2)) AS [Max inMB],
CAST([maxsize]/128.0-(FILEPROPERTY(name, 'SpaceUsed')/128.0) ASDECIMAL(10,2)) AS [Available Space inMB]
FROM sysfiles
ORDER BY groupid DESC
SELECT SUM(CAST(FILEPROPERTY(name, 'SpaceUsed')/128.0 AS DECIMAL(10,2))) AS [Space Used in MB]
FROM sysfiles
SELECT RTRIM(name) AS [Segment Name], groupid AS [Group Id], filename AS [File Name],
CAST(size/128.0 AS DECIMAL(10,2)) AS [Allocated Size in MB],
CAST(FILEPROPERTY(name, 'SpaceUsed')/128.0 AS DECIMAL(10,2)) AS [Space Used in MB],
CAST([maxsize]/128.0 AS DECIMAL(10,2)) AS [Max in MB],
CAST([maxsize]/128.0-(FILEPROPERTY(name, 'SpaceUsed')/128.0) AS DECIMAL(10,2)) AS [Available Space in MB]
FROM sysfiles
ORDER BY groupid DESC
This query shows the composition of data within the TempDB files. It was immediately apparent that it is not the user/system data that is taking up the space, but the so called version store. Normally that should be regularly cleaned up by an internal process, unless there is a dead thread/blocking/something broken within SQL:
Plain text
Copy to clipboard
Open code in new window
EnlighterJS 3 Syntax Highlighter
SELECT
--SUM(allocated_extent_page_count) AS [allocated extent pages used],
--(SUM(allocated_extent_page_count)*1.0/128) AS [allocated extent space in MB],
SUM(version_store_reserved_page_count) AS [version store pages used],
(SUM(version_store_reserved_page_count)*1.0/128) AS [version store space inMB],
SUM(user_object_reserved_page_count) AS [user object pages used],
(SUM(user_object_reserved_page_count)*1.0/128) AS [user object space inMB],
SUM(internal_object_reserved_page_count) AS [internal object pages used],
(SUM(internal_object_reserved_page_count)*1.0/128) AS [internal object space inMB],
SUM(mixed_extent_page_count) AS [mixed object pages used],
(SUM(mixed_extent_page_count)*1.0/128) AS [mixed object space inMB]
FROM sys.dm_db_file_space_usage;
SELECT
--SUM(allocated_extent_page_count) AS [allocated extent pages used],
--(SUM(allocated_extent_page_count)*1.0/128) AS [allocated extent space in MB],
SUM(version_store_reserved_page_count) AS [version store pages used],
(SUM(version_store_reserved_page_count)*1.0/128) AS [version store space in MB],
SUM(user_object_reserved_page_count) AS [user object pages used],
(SUM(user_object_reserved_page_count)*1.0/128) AS [user object space in MB],
SUM(internal_object_reserved_page_count) AS [internal object pages used],
(SUM(internal_object_reserved_page_count)*1.0/128) AS [internal object space in MB],
SUM(mixed_extent_page_count) AS [mixed object pages used],
(SUM(mixed_extent_page_count)*1.0/128) AS [mixed object space in MB]
FROM sys.dm_db_file_space_usage;
The following query has shown that session 224 was active for several days, with a sleeping state, thus preventing this TempDB cleanup on the version store to run.
Plain text
Copy to clipboard
Open code in new window
EnlighterJS 3 Syntax Highlighter
DECLARE @runtime datetime
SET @runtime = GETDATE()
PRINT'-- sys.dm_db_file_space_used'
selectCONVERT (varchar(30), @runtime, 121) AS runtime, SUM (user_object_reserved_page_count)*8as usr_obj_kb,
SUM (internal_object_reserved_page_count)*8as internal_obj_kb,
SUM (version_store_reserved_page_count)*8as version_store_kb,
SUM (unallocated_extent_page_count)*8as freespace_kb,
SUM (mixed_extent_page_count)*8as mixedextent_kb
FROM sys.dm_db_file_space_usage
PRINT' -- Output of active transactions which are using version store'
selectCONVERT (varchar(30), @runtime, 121) AS runtime,a.*,b.kpid,b.blocked,b.lastwaittype,b.waitresource,b.dbid,b.cpu,b.physical_io,b.memusage,b.login_time,b.last_batch,b.open_tran,b.status,b.hostname,b.program_name,b.cmd,b.loginame,request_id
from sys.dm_tran_active_snapshot_database_transactions a
innerjoin sys.sysprocesses b
on a.session_id = b.spid
PRINT' -- Input buffer of SPIDs identified above Output of active transactions which are using version store'
selectCONVERT (varchar(30), @runtime, 121) AS runtime,b.spid,c.*
from sys.dm_tran_active_snapshot_database_transactions a
DECLARE @runtime datetime
SET @runtime = GETDATE()
PRINT '-- sys.dm_db_file_space_used'
select CONVERT (varchar(30), @runtime, 121) AS runtime, SUM (user_object_reserved_page_count)*8 as usr_obj_kb,
SUM (internal_object_reserved_page_count)*8 as internal_obj_kb,
SUM (version_store_reserved_page_count)*8 as version_store_kb,
SUM (unallocated_extent_page_count)*8 as freespace_kb,
SUM (mixed_extent_page_count)*8 as mixedextent_kb
FROM sys.dm_db_file_space_usage
PRINT ' -- Output of active transactions which are using version store'
select CONVERT (varchar(30), @runtime, 121) AS runtime,a.*,b.kpid,b.blocked,b.lastwaittype,b.waitresource,b.dbid,b.cpu,b.physical_io,b.memusage,b.login_time,b.last_batch,b.open_tran,b.status,b.hostname,b.program_name,b.cmd,b.loginame,request_id
from sys.dm_tran_active_snapshot_database_transactions a
inner join sys.sysprocesses b
on a.session_id = b.spid
PRINT ' -- Input buffer of SPIDs identified above Output of active transactions which are using version store'
select CONVERT (varchar(30), @runtime, 121) AS runtime,b.spid,c.*
from sys.dm_tran_active_snapshot_database_transactions a
inner join sys.sysprocesses b
on a.session_id = b.spid
cross apply sys.dm_exec_sql_text(sql_handle) c
PRINT ' -- Open cursors'
select * from sys.dm_exec_cursors(0) a
cross apply sys.dm_exec_sql_text(sql_handle)
WHERE DATEDIFF(hh, a.creation_time, GETDATE()) > 1;
The above Session 224 was running on one of our AX integration AOS instances. As a quick fix, restarting the AX AOS service has released the API sessions.
The root cause analysis has revealed that if we refer tables, which have their configuration keys turned off, it can generate TempDB entries. In our case the sales order deletion batch job was running SalesLineType::delete. It has a LedgerCov::deleteTransact call, which is a delete_from ledgerCov in a transaction block. We have introduced a configuration key check for the table, and that has eliminated the out of control TempDB growth issue.
We highly recommend to have a close look at your TempDB usage, and try to identify which tables with a disabled configuration key can have a big performance impact on your environment by running code unnecessarily.
When you are used to snappy desktops or locally hosted virtual machines and suddenly you need to move to the cloud, you would expect to see similar capabilities for a reasonable price. Unfortunately that was not my experience when it comes to deploying AX 8.1 in Azure cloud. This post is about setting expectations straight for MSDyn365FO developer VM performance hosted in the cloud vs. locally.
First of all, when you deploy your developer VM on the cloud, you have two options. Standard and Premium, which is a reference to what kind of storage will be allocated to your machine. The default size is D13 (8 cores, 56 GB RAM) for regular rotating hard disks, and you need to use the DS-prefixed computers for the flash storage with memory-optimized compute. You can read up about them on these pages in more detail on the Microsoft Docs site:
When it comes to premium performance, the Virtual Machine template that Microsoft has built for the LifeCycle Services deployment is using the following structure:
We recently have implemented a new Picking application in our warehouse. Our slow performing statement e-mail has immediately highlighted that with our data volume the WMSOrder and SalesTable records were underperforming, taking 5+ seconds each time when the form was opened (close to 20). We needed to fix the Picking list registration performance.
WMSOrder
Apparently it is a standard AX form and table, but the link which they have been using is incorrectly defined, resulting in an InnerJoin for SalesTable unnecessarily.
Picking list registration performance
Also the field used for the join has no index, you should create one for WMSOrder.InventTransRefId to gain more performance.
After the adjustment it looks much better and performs really fast: